




Comprehensive Guide to the EV Charging Pile Supply Chain: Structure, Components & Market Dynamics
 Jul 25, 2026|
 01. Industrial Chain Overview
The Electric Vehicle Supply Equipment (EVSE) ecosystem - commonly referred to as EV charging piles - forms the foundational backbone of the electric mobility revolution. The industrial chain spans from raw electronic component manufacturing to software-driven charge point management networks:
- Upstream: Hardware component manufacturing (charging modules, main control boards, charging guns, power devices).
- Midstream: System integration, charger assembly, and station build-out.
- Downstream: Charging network operations, fleet management, and vehicle manufacturer (OEM) integration.
02. EV Charging Pile Classification: AC vs. DC
EV charging infrastructure is primarily divided into DC Fast Chargers (Direct Current) and AC Slow Chargers (Alternating Current), tailored to distinct operational scenarios.
| Feature | AC Slow Chargers | DC Fast Chargers |
| Primary Use Case | Residential garages, overnight workplace parking | Public fast-charging hubs, highway service stations |
| Power Conversion | On-Board Charger (OBC) inside the vehicle | Built-in AC/DC rectifier modules inside the pile |
| Typical Power Output | Under 10 kW (commonly 3.5 kW – 22 kW) | 50 kW to 360+ kW (Ultra-Fast) |
| Battery Impact | Low thermal stress; extends battery lifespan | Higher thermal load; requires active liquid cooling |
| Cost Profile | Low hardware cost; simple installation | High capital expenditure; requires grid upgrades |
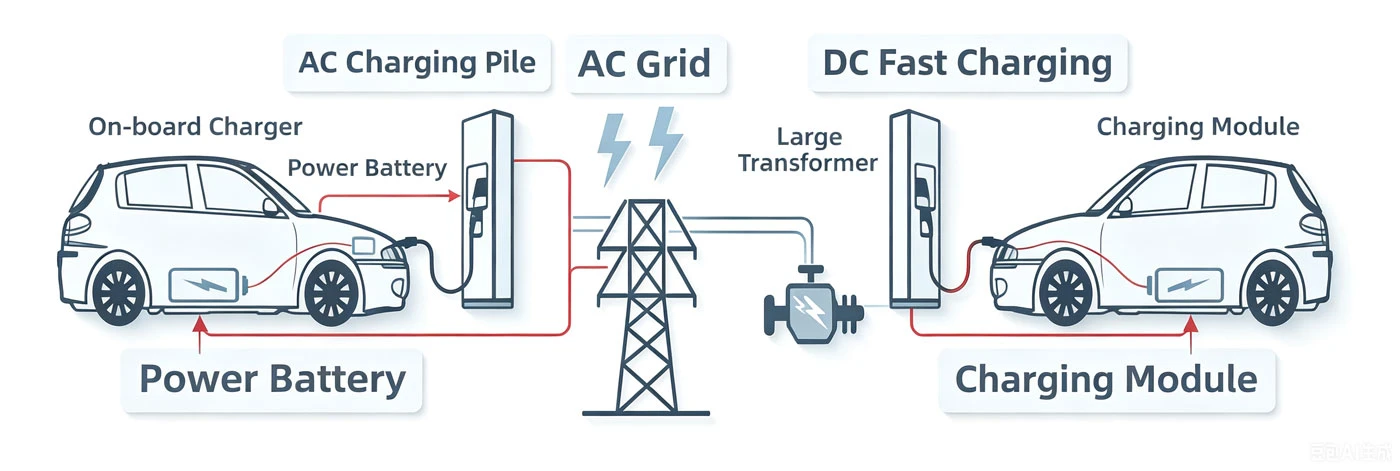
AC Slow Chargers
AC chargers deliver grid electricity directly to the vehicle's On-Board Charger (OBC), which converts AC to DC to charge the battery pack. Because space and weight constraints limit the size of on-board chargers, AC charging power remains relatively low (typically under 10 kW). However, AC charging generates minimal heat, preserving battery health over long cycles, making it the ideal choice for residential overnight charging.
DC Fast Chargers
DC fast chargers bypass the vehicle's internal OBC by converting AC grid power to high-voltage DC directly within the station terminal. Equipped with high-power internal converter modules, they deliver high current straight to the traction battery, drastically cutting charge times and serving as the primary infrastructure for long-distance transit.
03. Upstream Industrial Chain: Component Manufacturing
The upstream sector produces the core hardware and electronic components. A commercial DC charging pile consists of five primary hardware assemblies:
Charging Module (Power Converter): Converts AC grid power to dynamic DC voltage based on requests from the vehicle's Battery Management System (BMS).
- Main Control Board: Serves as the central computing unit, executing safety protocols, metering, billing, and server communication.
- Charging Cable & Connector (Gun): Delivers power and high-speed data signals (e.g., ISO 15118 PLC communication) between the charger and vehicle.
Enclosure & Sheet Metal: Houses and protects internal power electronics against harsh weather conditions (IP54/IP65 ingress protection ratings).
- Electrical Auxiliary Components: Includes contactors, circuit breakers, surge protectors, and isolation relays for grid safety.
The Heart of the Charger: Power Modules
As the most critical component, charging modules account for over 40% of the total manufacturing cost of a DC charger. These modules are assembled from power devices (MOSFETs, SiC devices), capacitors, magnetic components (transformers/inductors), and printed circuit boards (PCBs). The transition toward Silicon Carbide (SiC) semiconductor devices is driving higher efficiency (>96%), higher power density, and reduced thermal dissipation.
04. Midstream Industrial Chain: Integration & Market Supply Dynamics
Midstream players synthesize upstream hardware into turn-key charging systems and build out station infrastructure.
Supply & Demand Metrics
Despite massive infrastructure rollouts, charging supply remains tight relative to rapidly growing EV fleets:
- Vehicle-to-Pile Ratios: By the end of 2024, China reached a total stock of over 12.8 million charging points across public and private domains, achieving an overall vehicle-to-pile ratio around 2.7:1.
- Public Infrastructure Deficit: When evaluating public access alone, the vehicle-to-public-charger ratio rises to approximately 7.5:1 to 10:1 globally.
- Dominance of AC Piles: While AC home chargers account for roughly 80–85% of total installed units, high-power DC fast chargers represent the highest growth vector to address range anxiety on commercial transit routes.
International Market Landscape
Overseas markets present substantial growth runway due to structural supply deficits:
- Europe: Infrastructure growth continues to lag EV adoption, with public vehicle-to-charger ratios exceeding 13:1 to 14:1 in several regions, dominated primarily by AC slow chargers. Established electrical equipment leaders like ABB, Siemens, and Schneider Electric maintain strong market footprints.
- United States: Public charger ratios sit above 20:1, indicating significant room for ultra-fast highway charging deployment. The market remains fragmented among software-and-hardware network providers like ChargePoint, alongside dedicated fast-charging networks.
05. Downstream Industrial Chain: Operations & Monetization
Downstream operators manage charging networks, interface with utility grids, and directly serve end users.
Mainstream Operating Models
- Asset-Heavy Operators: Companies that own, install, and operate charging hardware (e.g., dedicated charging networks).
- Third-Party Service Providers: Platform providers offering software (SaaS), interoperability, and billing solutions to station owners.
- OEM-Owned Networks: Vehicle manufacturers building branded charging networks to enhance consumer buying confidence (e.g., Tesla Supercharger network).
Revenue Streams & Monetization
- Electricity Tariffs: Pass-through energy cost billed per kilowatt-hour (kWh).
- Charging Service Fees: Premium markup per kWh or per minute to cover station capital costs and maintenance.
- Parking & Idle Fees: Charges applied when a vehicle remains parked after reaching target state-of-charge (SOC).
- Value-Added Services: In-app advertising, station retail services, and grid demand-response payouts.
06. Strategic Industry Trends
1. High-Power & Megawatt Charging Architecture
The industry is pivoting toward 800V high-voltage platforms capable of delivering 360 kW to 480 kW+ output. Liquid-cooled charging cables and connectors are becoming mandatory to handle currents above 500A without overheating.
2. Smart Grid Integration (V2G & Solar-Storage-Charging)
Charging stations are evolving into distributed energy nodes:
- Vehicle-to-Grid (V2G): Bidirectional power transfer enables EVs to feed energy back to the grid during peak demand.
- PV-Storage-Charging Microgrids: Integrating rooftop solar panels (photovoltaics) and stationary energy storage systems (BESS) reduces grid impact during high-power charging bursts.
3. Market Consolidation & Software Interoperability
While long-tail regional operators exist, competitive moats - such as grid connection access, site acquisition rights, and capital scale - are driving consolidation toward dominant national networks. Standard protocols like OCPP (Open Charge Point Protocol) and ISO 15118 (Plug & Charge) are rapidly becoming industry standard.